Every day, millions of websites generate billions of data points — page views, clicks, scrolls, purchases. Yet most businesses use less than 10% of this data to inform their decisions. The gap between collecting data and acting on it is where web analytics earns its value.
I’ve spent over 12 years helping European and global brands turn raw website data into revenue growth. In that time, I’ve seen companies waste six-figure budgets on campaigns they never measured, and I’ve watched small teams double their conversions by tracking the right five metrics. The difference isn’t the tools — it’s the strategy.
This guide covers everything you need to master web analytics in 2026: from foundational concepts and essential metrics to privacy-compliant tracking, GA4 implementation, attribution modeling, and the trends shaping our field. Whether you’re a marketer setting up your first dashboard or an analyst refining your measurement framework, you’ll find actionable steps you can apply today.
What Is Web Analytics?
Web analytics is the systematic collection, measurement, analysis, and reporting of website data to understand and optimize web usage. It answers the fundamental question every business asks: “Is our website working?”
A common misconception is confusing web analytics (the discipline) with Google Analytics (one tool among many). Web analytics as a practice predates Google Analytics by over a decade — it started with server log file analysis in the 1990s, evolved through page tagging in the 2000s, and has now shifted to event-based tracking models.
Modern web analytics encompasses three layers:
- Data collection — capturing user interactions through tags, pixels, and server-side events
- Data processing — transforming raw hits into sessions, users, and meaningful dimensions
- Data analysis — extracting patterns, testing hypotheses, and generating recommendations
The tools have evolved, but the core purpose hasn’t changed: reduce guesswork in business decisions by replacing opinions with evidence.
Why Web Analytics Matters for Your Business
Without web analytics, marketing is gambling. You might get lucky, but you can’t replicate success or diagnose failure. Here’s what proper analytics enables:
Measure what works (and stop what doesn’t). When I audited a mid-size e-commerce brand’s ad spend last year, we discovered 38% of their budget went to channels that generated clicks but zero conversions. Within one quarter of reallocating that budget based on analytics data, their ROAS improved by 2.4×.
Understand user behavior. Analytics reveals what visitors actually do — not what you assume they do. Heat maps, scroll depth, and event tracking show where users engage, where they hesitate, and where they leave.
Prove ROI to stakeholders. Every marketing team needs to justify its budget. Web analytics provides the numbers: cost per acquisition, customer lifetime value, conversion rates by channel. These aren’t vanity metrics — they’re the language finance teams speak.
Optimize user experience. Page load time, navigation paths, form abandonment rates — analytics data identifies friction points that directly impact revenue. According to Google’s research, a 1-second delay in page load can reduce conversions by up to 7%.
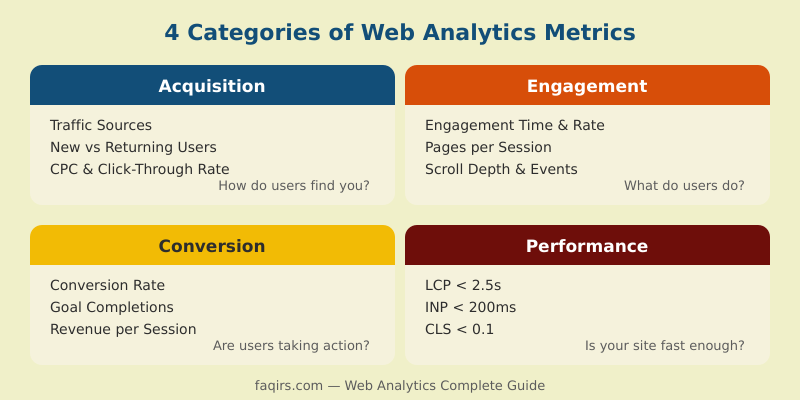
The 4 Categories of Metrics Every Analyst Should Track
Not all metrics matter equally. I organize web analytics metrics into four categories, each answering a different business question.
1. Acquisition Metrics: How Do Users Find You?
Acquisition metrics show where your traffic comes from and how effectively each channel drives visitors.
- Sessions by source/medium — which channels deliver traffic
- New vs. returning users — growth vs. retention balance
- Cost per click (CPC) — paid channel efficiency
- Click-through rate (CTR) — how compelling your listings are
Pro tip: Always use UTM parameters for campaigns. I’ve seen teams spend months analyzing “direct” traffic that was actually untagged email campaigns.
2. Engagement Metrics: What Do Users Do on Your Site?
Engagement metrics reveal content quality and user interest.
- Average engagement time — how long users actively interact (GA4 measures this better than the old “session duration”)
- Pages per session — content depth and internal linking effectiveness
- Scroll depth — how far users read your content
- Event count — specific interactions (video plays, downloads, button clicks)
In GA4, the engagement rate replaced bounce rate as the default metric. A session counts as “engaged” if it lasts over 10 seconds, triggers a conversion event, or includes 2+ page views.
3. Conversion Metrics: Are Users Taking Action?
Conversion metrics connect website activity to business outcomes.
- Conversion rate — percentage of sessions (or users) completing a goal
- Goal completions — total count of desired actions
- Revenue per session — average monetary value generated
- Cart abandonment rate — for e-commerce, the percentage who add items but don’t purchase
The most common mistake here is tracking a single conversion. Most businesses have a conversion funnel with micro-conversions (newsletter signup, PDF download) leading to macro-conversions (purchase, demo request). Track the entire funnel.
4. Performance Metrics: Is Your Site Fast Enough?
Technical performance directly impacts user experience and SEO rankings.
- Largest Contentful Paint (LCP) — target under 2.5 seconds
- Interaction to Next Paint (INP) — target under 200ms
- Cumulative Layout Shift (CLS) — target under 0.1
- Server response time (TTFB) — target under 800ms
Google’s Core Web Vitals are now confirmed ranking signals. Monitor them in Google Search Console and your analytics tool. When one of my clients improved their LCP from 4.2s to 1.8s, organic traffic increased 23% within two months — with no other SEO changes.
How to Build a Web Analytics Strategy From Scratch
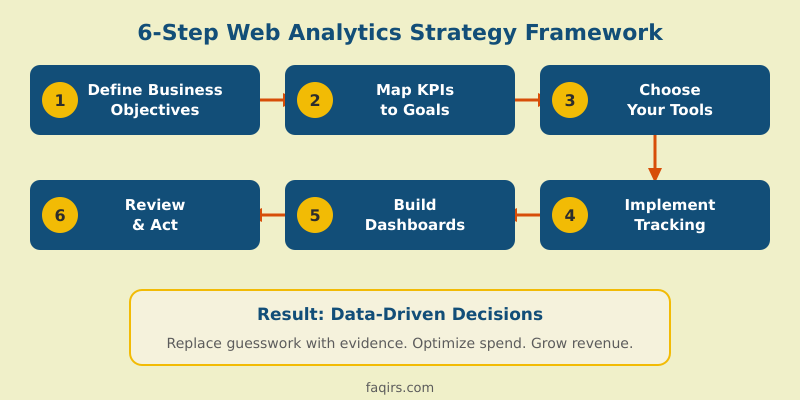
Tools are useless without a strategy. Here’s the six-step framework I use with every client:
Step 1: Define business objectives. Start with the business, not the data. What does success look like? Revenue growth, lead generation, brand awareness? Write down 2-3 primary objectives.
Step 2: Map objectives to measurable KPIs. Each objective needs a number. “Increase revenue” becomes “Increase online revenue by 20% in Q3.” “Generate leads” becomes “Achieve 500 qualified demo requests per month.”
Step 3: Choose your tools. Match tools to your needs and constraints. GA4 covers most use cases for free. If privacy is a priority (and in Europe, it must be), consider Matomo, Plausible, or Fathom. For enterprise needs, look at Adobe Analytics or Piwik PRO.
Step 4: Implement tracking correctly. Create a tracking plan — a document listing every event, parameter, and trigger. Use Google Tag Manager (or a server-side equivalent) for deployment. Test everything in a staging environment before going live.
Step 5: Build dashboards for your audience. Executives need high-level KPIs. Marketing managers need channel performance. Developers need error rates and performance data. One dashboard rarely serves all stakeholders.
Step 6: Establish a review cadence. Data without action is decoration. Set weekly reviews for campaign metrics, monthly reviews for strategic KPIs, and quarterly deep dives for trend analysis.
Privacy-First Analytics: GDPR Compliance in 2026
Working across Europe for the past decade, I’ve watched privacy regulations transform web analytics from an afterthought into a strategic imperative. In 2026, privacy-first analytics isn’t optional — it’s the baseline.
The GDPR reality. Since 2018, European data protection authorities have issued over €4.5 billion in GDPR fines. Several of these targeted analytics practices: the Austrian and French DPAs ruled that standard Google Analytics implementations transferred personal data to the US in violation of GDPR. While Google introduced EU-based data processing for GA4, the legal landscape remains complex.
What “compliant” actually means:
- Consent before tracking. Under GDPR and the ePrivacy Directive, you need informed consent before placing analytics cookies. A proper Consent Management Platform (CMP) is essential — not just a banner, but a system that blocks tags until consent is granted.
- Data minimization. Collect only what you need. IP anonymization, limited data retention periods (GA4 defaults to 2 or 14 months), and avoiding unnecessary user identifiers.
- Processing agreements. Ensure your Data Processing Agreement (DPA) with your analytics vendor covers all GDPR requirements: sub-processors, data deletion, breach notification.
Privacy-first alternatives. If you want to simplify compliance, several tools operate without cookies and don’t require consent banners:
- Matomo (self-hosted) — full-featured, GDPR-compliant by design when self-hosted. You own all data.
- Plausible Analytics — lightweight, cookieless, EU-hosted. No personal data collected.
- Fathom Analytics — privacy-focused, simple dashboard, no consent required.
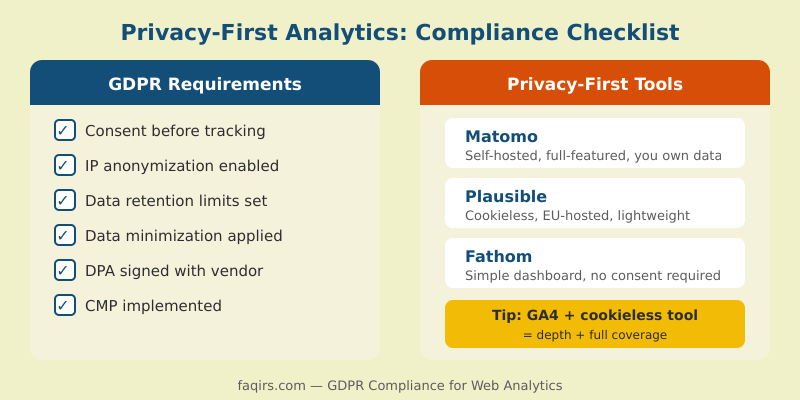
My recommendation: use GA4 with proper consent management for its advanced analysis capabilities, and run a cookieless tool (like Plausible) in parallel to capture data from users who decline cookies. This gives you both depth and coverage.
Getting Started With GA4: Setup Essentials
Google Analytics 4 is now the standard for most websites. Here’s how to set it up correctly from day one.
Account structure. One account per business, one property per website/app. Keep it clean — I’ve inherited setups with dozens of unused properties that made reporting a nightmare.
Data streams. Add a web data stream for your site. Enable Enhanced Measurement for automatic tracking of scrolls, outbound clicks, site search, video engagement, and file downloads.
Custom events. Enhanced Measurement covers basics, but your key business actions need custom events. Examples:
generate_lead— form submissionsign_up— account creationpurchase— transaction completedadd_to_cart— product added to cart
Implement these through Google Tag Manager with a clear naming convention. I use the format category_action — it keeps reports readable as your event list grows.
Conversions. In GA4, any event can be marked as a conversion (called a “key event” since March 2024). Mark your 3-5 most important events. Don’t mark everything — it dilutes the signal.
Data retention. Set retention to 14 months (the maximum) if your privacy policy allows it. The default 2-month setting limits your ability to do year-over-year comparisons in Explorations.
Link Google Search Console. This integration gives you organic search query data inside GA4. It’s free, takes two minutes, and there’s no reason not to do it.
Common Web Analytics Mistakes (And How to Avoid Them)
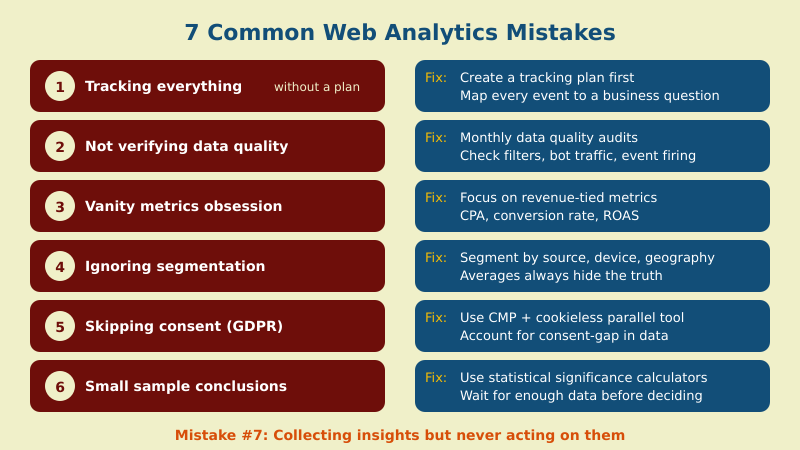
In 12 years of consulting, I’ve seen these mistakes repeatedly. Most are easy to fix once you recognize them.
1. Tracking everything without a plan. More data isn’t better data. Every event and parameter you track adds noise. Start with your tracking plan (Step 4 above) and only add what maps to a business question.
2. Trusting data without verifying quality. Check your data regularly. Are filters applied correctly? Is bot traffic excluded? Are events firing on all pages? I run a monthly data quality audit for every client — it takes 30 minutes and has prevented costly reporting errors.
3. Obsessing over vanity metrics. Page views and total sessions feel impressive but say nothing about business impact. Focus on metrics tied to revenue: conversion rate, cost per acquisition, customer lifetime value.
4. Ignoring data segmentation. Averages lie. Your “3% conversion rate” might hide a 12% rate from email traffic and 0.5% from social media. Always segment by source, device, geography, and user type before drawing conclusions.
5. Skipping consent management. Especially in Europe, launching analytics without proper consent is both illegal and analytically misleading. If 40% of your users decline cookies, your GA4 data represents only 60% of actual traffic. Acknowledge and account for this gap.
6. Drawing conclusions from small sample sizes. A landing page with 50 visits and a 6% conversion rate isn’t necessarily better than one with 5,000 visits and a 3% rate. Statistical significance matters. Use a calculator before making decisions on limited data.
7. Collecting insights but never acting. The most expensive analytics mistake is doing nothing with your findings. Every report should end with “So what?” and “Now what?” If your analysis doesn’t lead to a specific action, it was just an exercise.
Beyond Basics: Attribution and ROI Measurement
Once your tracking is solid, the next challenge is understanding which touchpoints drive results. This is where attribution modeling comes in.
The problem with last-click. Default attribution in most tools gives 100% credit to the last touchpoint before conversion. But customers rarely convert on first visit. The average B2B buyer has 8-10 touchpoints before purchasing. Last-click attribution ignores the blog post that built awareness, the email that nurtured interest, and the retargeting ad that brought them back.
Common attribution models:
- Last-click — all credit to the final touchpoint (simple but misleading)
- First-click — all credit to the first touchpoint (values awareness channels)
- Linear — equal credit to every touchpoint (democratic but undifferentiated)
- Time-decay — more credit to touchpoints closer to conversion (pragmatic for most businesses)
- Data-driven — machine learning distributes credit based on actual impact (GA4’s default for properties with sufficient data)
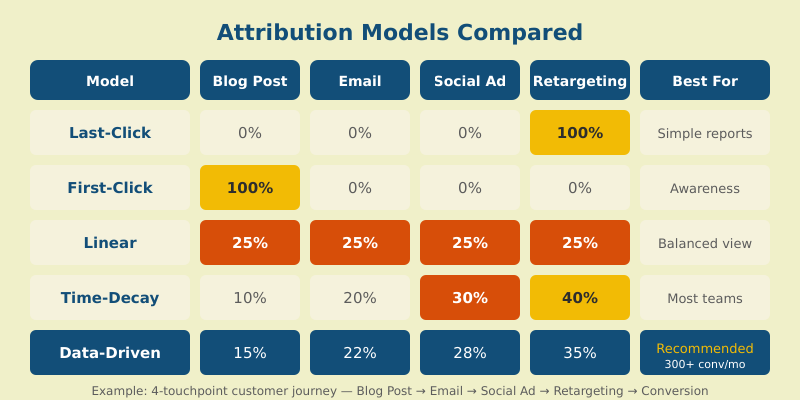
For most mid-size businesses, I recommend starting with data-driven attribution in GA4 if you have enough conversion volume (typically 300+ conversions per month). For smaller volumes, time-decay provides a reasonable approximation.
Measuring marketing ROI. The formula is simple: (Revenue from marketing - Marketing cost) / Marketing cost × 100. The challenge is accurate revenue attribution. Connect your CRM to your analytics to track the full journey from first click to closed deal — especially for B2B where sales cycles span months.
The Future of Web Analytics: Trends for 2026 and Beyond
The analytics landscape is shifting rapidly. Here are the trends I’m watching closely:
Server-side tracking. Client-side tracking (JavaScript tags) is increasingly unreliable due to ad blockers, browser privacy features (ITP, ETP), and cookie restrictions. Server-side tracking via Google Tag Manager Server Container or similar tools bypasses these limitations while maintaining data control.
AI-powered insights. GA4’s anomaly detection and predictive metrics (purchase probability, churn probability) are just the beginning. Expect AI to move from “what happened” to “what will happen” and “what should you do about it.”
Cookieless measurement. With third-party cookies largely gone, first-party data strategies are essential. Google’s Privacy Sandbox APIs (Topics, Attribution Reporting), probabilistic modeling, and consent-based approaches are replacing cookie-dependent tracking.
Composable analytics stacks. The monolithic analytics platform is giving way to modular architectures: event collection (Segment, RudderStack), storage (BigQuery, Snowflake), visualization (Looker Studio, Tableau). This gives teams flexibility but requires stronger technical skills.
Regulatory expansion. Beyond GDPR, new privacy laws are emerging globally: the US has state-level legislation (CCPA, VCDPA, CPA), Brazil’s LGPD is enforced, and more countries are following. Building privacy into your analytics architecture now saves painful migrations later.
Frequently Asked Questions
What is web analytics and why is it important?
Web analytics is the practice of collecting, measuring, and analyzing website data to understand user behavior and optimize business outcomes. It’s important because it replaces guesswork with evidence, helping you allocate budgets effectively, improve user experience, and prove marketing ROI with concrete numbers.
What is the difference between web analytics and Google Analytics?
Web analytics is the discipline — the practice of measuring and analyzing website performance. Google Analytics is one specific tool within that discipline. Alternatives include Matomo, Adobe Analytics, Plausible, and Piwik PRO. Choosing the right tool depends on your privacy requirements, budget, and analysis needs.
What web analytics metrics should I track for my business?
Focus on metrics tied to your business objectives. Track acquisition metrics (traffic sources, CPC) to understand where users come from, engagement metrics (engagement rate, scroll depth) to measure content quality, conversion metrics (conversion rate, revenue) to gauge business impact, and performance metrics (Core Web Vitals) to ensure technical health.
Is Google Analytics GDPR compliant in 2026?
GA4 with EU-based data processing and proper consent management can be GDPR compliant, but it requires careful configuration: a valid Consent Management Platform, IP anonymization, appropriate data retention settings, and a signed Data Processing Agreement. For simpler compliance, privacy-first alternatives like Matomo (self-hosted) or Plausible operate without cookies.
How does web analytics work without cookies?
Cookieless analytics uses alternative methods: first-party data, server-side tracking, fingerprint-free statistical modeling, and privacy-preserving APIs. Tools like Plausible and Fathom identify unique visits through anonymized request attributes without storing cookies. Google’s Privacy Sandbox introduces Topics API and Attribution Reporting API as cookie-free alternatives.
Your Next Steps
Web analytics is a practice, not a one-time setup. Start with the fundamentals: define your objectives, choose the right metrics, implement tracking with a proper plan, and — most importantly — act on what you find.
If you’re just getting started, set up GA4 with Enhanced Measurement and link Google Search Console. If you’re already tracking, audit your data quality and build a dashboard tied to business KPIs. And if privacy compliance keeps you up at night, explore the privacy-first tools mentioned above.
The data is there. The question is whether you’ll use it. In the following articles, I’ll dive deeper into each topic covered here — from step-by-step GA4 event tracking to building attribution models that actually inform budget decisions.